
In this tutorial, you will learn how to subscribe to an Ethereum WebSocket using Web3.js to dynamically pull pending transactions on the blockchain.
Recently, I have been pretty lurking on the Ethereum StackExchange, and I have been seeing a pretty common question repeat itself.
How can I detect when a specific transaction occurs on Ethereum?
It might be that the user wants to see every time their account gets a payment. Or maybe they want track when another contract sends Ether.
By trying to answer this question I learned in Web3.js 1.0 is introducing support for WebSockets, which will allow client applications to have an open and interactive session with the Ethereum blockchain. With WebSockets, you can automatically receive event-driven responses from Ethereum without having to repeatedly poll the blockchain. (As of this writing, Web3.js 1.0 is still in beta.)
As of right now, you can subscribe to 4 kinds of events: pendingTransactions, newBlockHeaders, syncing, and logs.
Logs are particularly interesting because you can add additional options like an Ethereum address to only get back the logs for that account, which will allow you to really easily monitor when different events happen, such as a payment.
var subscription = web3.eth
  .subscribe(
    "logs",
    {
      address: "0x123456..",
      topics: ["0x12345..."],
    },
    function (error, result) {
      if (!error) console.log(result);
    }
  )
  .on("data", function (log) {
    console.log(log);
  })
  .on("changed", function (log) {});

// unsubscribes the subscription
subscription.unsubscribe(function (error, success) {
  if (success) console.log("Successfully unsubscribed!");
});
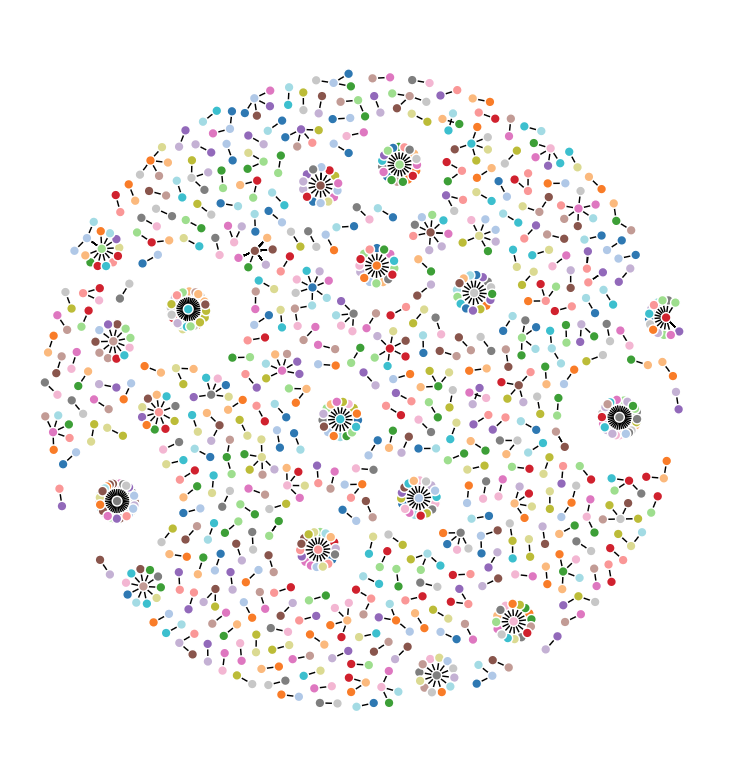
ETH Transaction Graph
I wanted try out this feature, so I decided I would build a little visual which would show transactions on the Ethereum blockchain. I thought it would be cool to let transactions come in, and see if we can start to find addresses which have a ton of activity. A natural visual for transactions is to draw a graph, and if we do things correctly, we should see these central nodes appear; where tons of different addresses are interacting with a single Ethereum contract or other type of account.
You can check out the web app I built here: https://shawntabrizi.com/ETH-Transaction-Graph/. Letting it run for a little bit will generate a neat force-directed graph drawing like the one below:
You can find the source code to this app on my GitHub.
How does it work?
Before you can do anything with Web3.js, you will need to gain access to an Ethereum WebSocket. This technology is still pretty new, so there aren't many options. But you can always rely on Infura to be ahead of the game. Although as of this writing, WebSockets on Infura are not quite production ready, they should be in the near future. Connecting to the WebSocket is easy:
var web3 = new Web3("wss://mainnet.infura.io/_ws");
Note that it is important you do not include the normal check for MetaMask, since the browser plugin does not yet support WebSockets.
Now that you are connected to your WebSocket, you just need to set up a subscription using Web3.js:
subscription = web3.eth
  .subscribe("pendingTransactions", function (error, result) {})
  .on("data", function (transactionHash) {
    web3.eth.getTransaction(transactionHash).then(function (transaction) {
      createNode(transaction.from, transaction.to);
    });
  });
Using the code above, I will get a stream of transactions hashes coming to my app. Whenever I get a transaction hash, I use web3.eth.getTransaction to then get data about the transaction. Finally, from that data, I get the to address and the from address. These go into my createNode function which adds the transaction to the graph drawing. I won't be going into much details about D3.js, which generates the graph, because it is black magic to me. (Lots of copy and pasting code to get this sample to work...)
If you are setting up a subscription, don't forget to also set up a way to unsubscribe! This is particularly important for my little sample because the browser starts to get REALLY slow once you have a few thousand transactions drawn.
subscription.unsubscribe(function (error, success) {
  if (success) console.log("Successfully unsubscribed!");
});
That's really all you need to know to set up a sample similar to this! I wanted to keep this example as dead simple as possible, but you could imagine a million ways to modify and improve the design here. For example, imagine having each node grow and shrink as Ether is sent to and from the Ethereum Address! If you want to fork my code, I would love to see what kinds of projects you can think of using my sample as a baseline.
As always, I am excited to share with you fun, simple projects in the Ethereum development space, and I would love to hear any and all feedback you have. Know a cool project that you think someone should build and write about? Let me know!
If this post helped you, and you want to say "Thanks!", take a look at my donations page.